
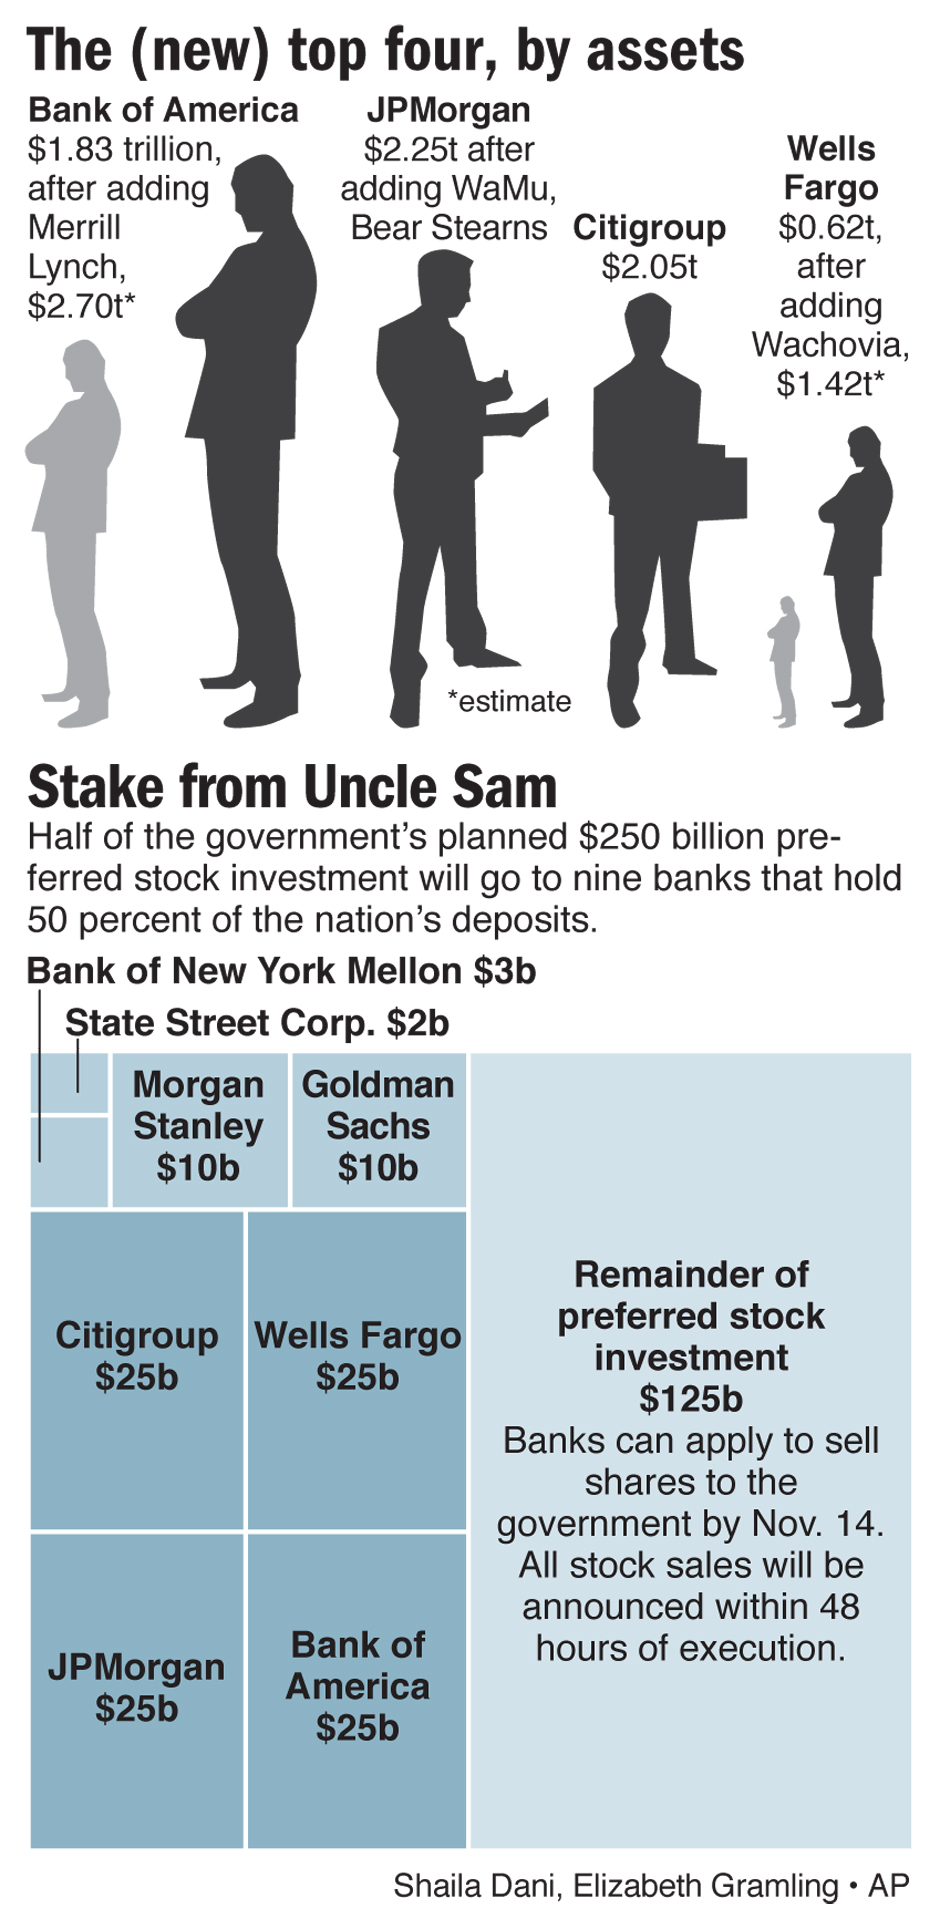
This picture graphic shows the sizes of the four largest U.S. banks by assets. The treemap shows how the government’s $250 billion preferred stock investment was split up. For The Associated Press. Sources: the companies, analysts, AP reports.

This picture graphic shows the sizes of the four largest U.S. banks by assets. The treemap shows how the government’s $250 billion preferred stock investment was split up. For The Associated Press. Sources: the companies, analysts, AP reports.
